VisualDOC: Software for Process Integration and Multidiscipline Design Optimization
VisualDOC is a general purpose multidiscipline design optimization and process integration software. It is a tool for design process definition, integration, execution, and automation.
The design modules included are:
- Multidiscipline design optimization
- Design of Experiments
- Response Surface Approximation
- Probabilistic (Robust and Reliability-based) Analysis
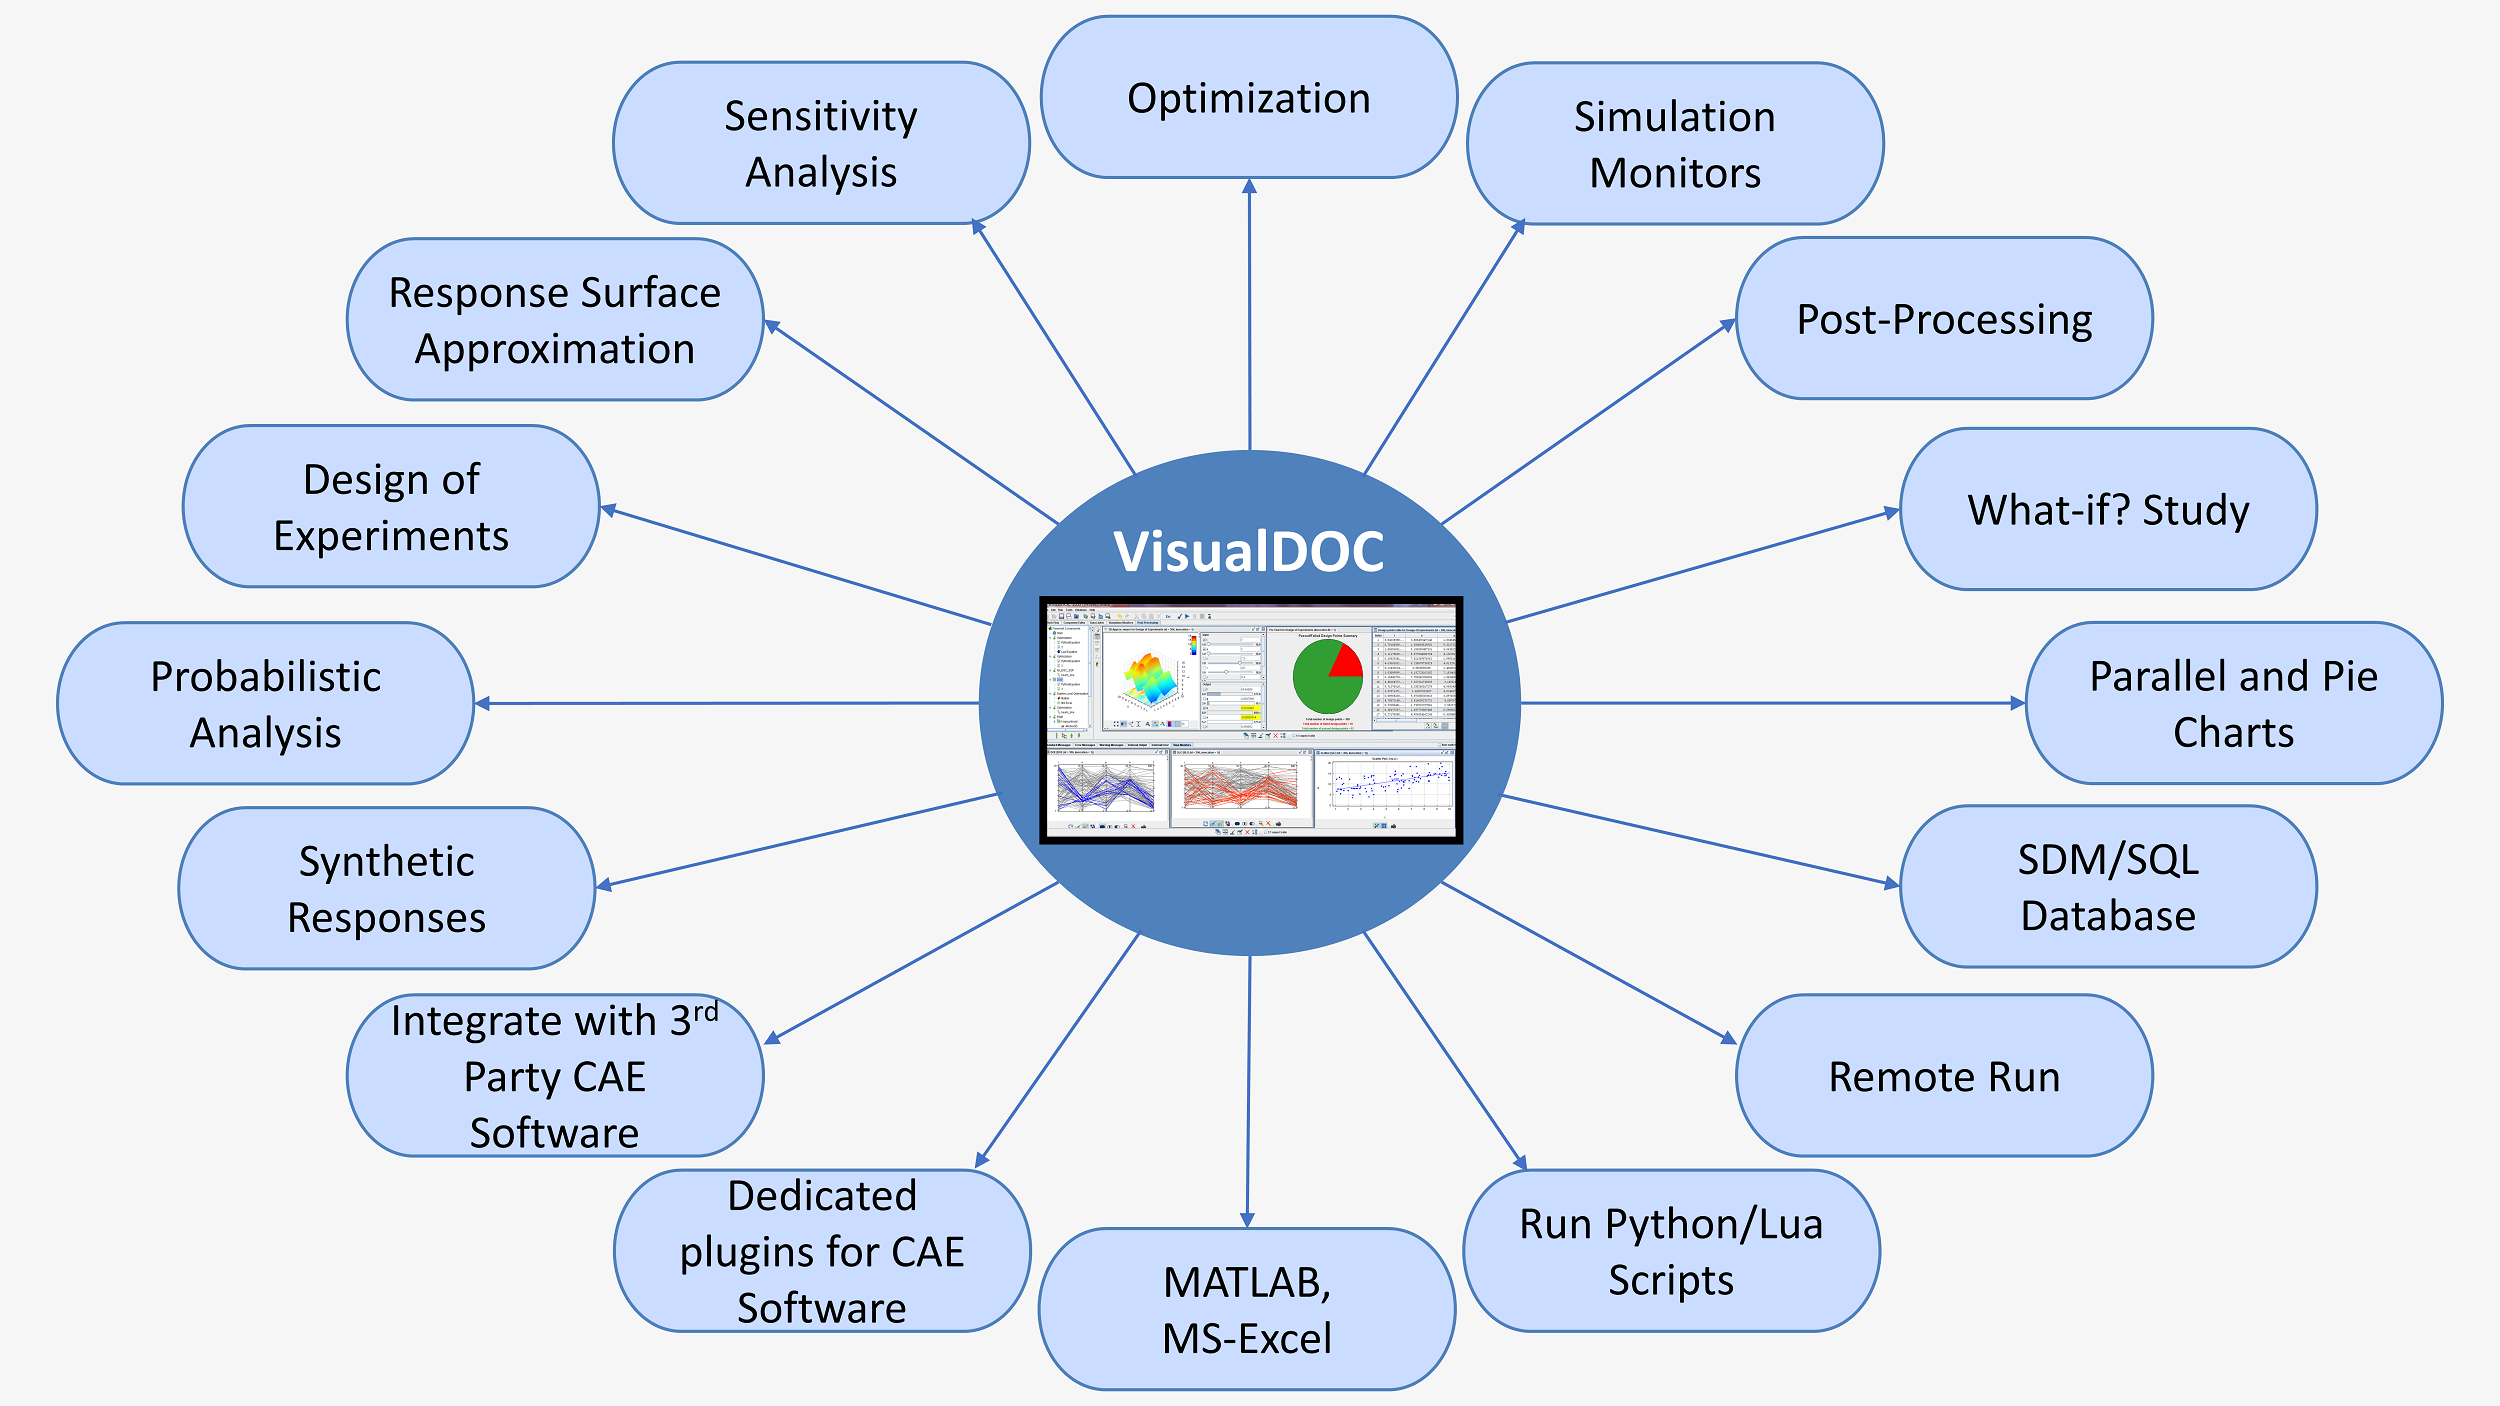
VisualDOC Features
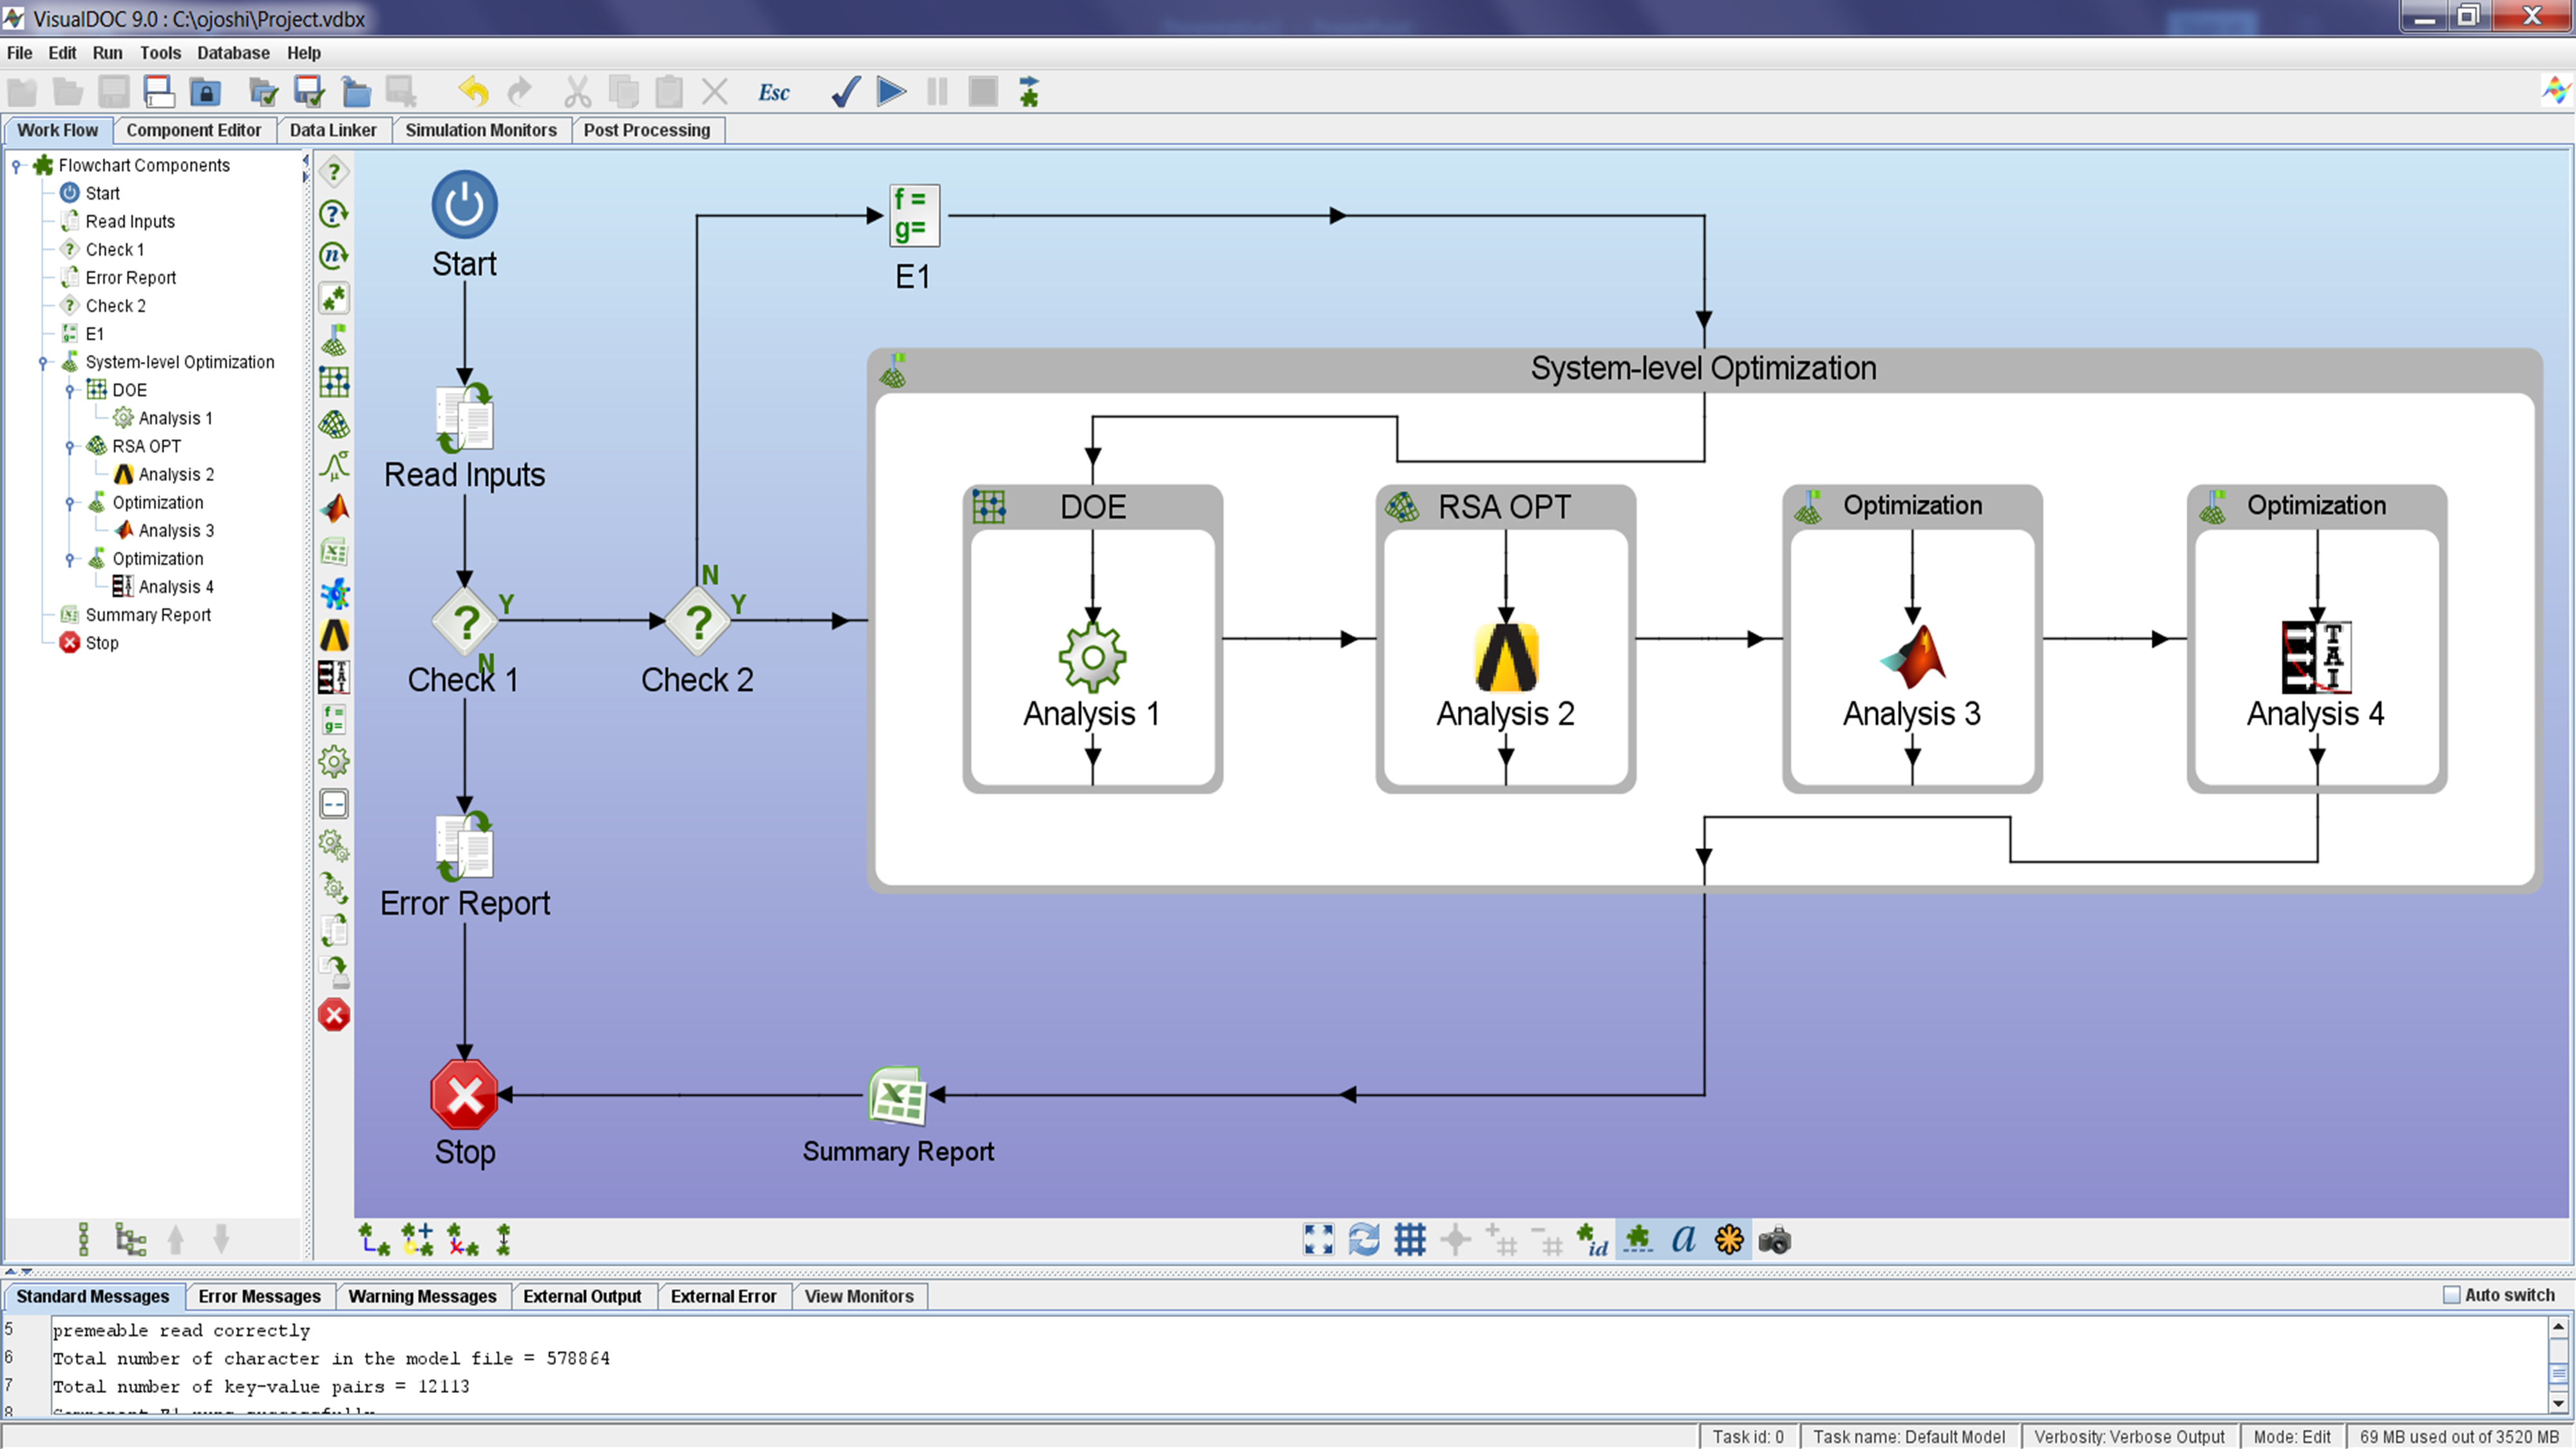
VisualDOC allows the user to graphically create a connected workflow of components and define each component in the flowchart appropriately. VisualDOC features include:
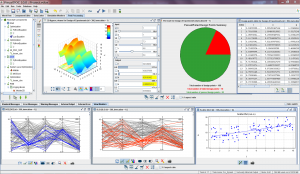
- Comprehensive concurrent monitoring and visualization tools
- Storage and reuse of generated simulation data for post-processing
- Full debugging support for model execution
- The ability to interactively inspect and monitor the design process.
VisualDOC Integrations
Integrates with Excel, Matlab, ANSYS Workbench, TAITherm, Moldex3D, various other CAE software, and user-defined libraries and executables. Scripting support (via python, Lua) is included in VisualDOC. It also supports batch-mode execution and provides programmatic access to all the included design modules. VisualDOC API can be used to embed the included design algorithms into user’s own program. The API is provided with interfaces for Fortran, C, and C++.
VisualDOC developers are not just programmers, they are also researchers and experts in design optimization. They have not only created best-in-class optimizers and response surface methods, but have also contributed to the advancement of design methodologies. For example, they have invented a unique and efficient way to quickly get optimal Latin Hypercube points as shown in our publication How to Implement an Affordable Optimal Latin Hypercube.
VisualDOC Highlights
- Add multidiscipline design optimization to virtually any CAE analysis software
- Define your design process as a flowchart (natural and intuitive interface)
- Combine analysis and simulation data from multidiscipline design optimizations
- Perform various trade-off studies and identify important design parameters
- Share information and data for better decision making
- Powerful and comprehensive Simulation Data Management (SDM) capability
- Allows the user to graphically create a connected workflow of components and define each component in the flowchart appropriately
VisualDOC Benefits
The benefits of VisualDOC include:
- Automate your design processes
- Reduce cost and design cycle time
- Improve product reliability and efficiency
- From concept, preliminary, and/or detailed design to manufacture
- Share and distribute your design process